

Maritime Logistics Services Market to Exceed $ 1,127.8 Billion by 2035 as Green Regulation & Digitalization Drive Growth
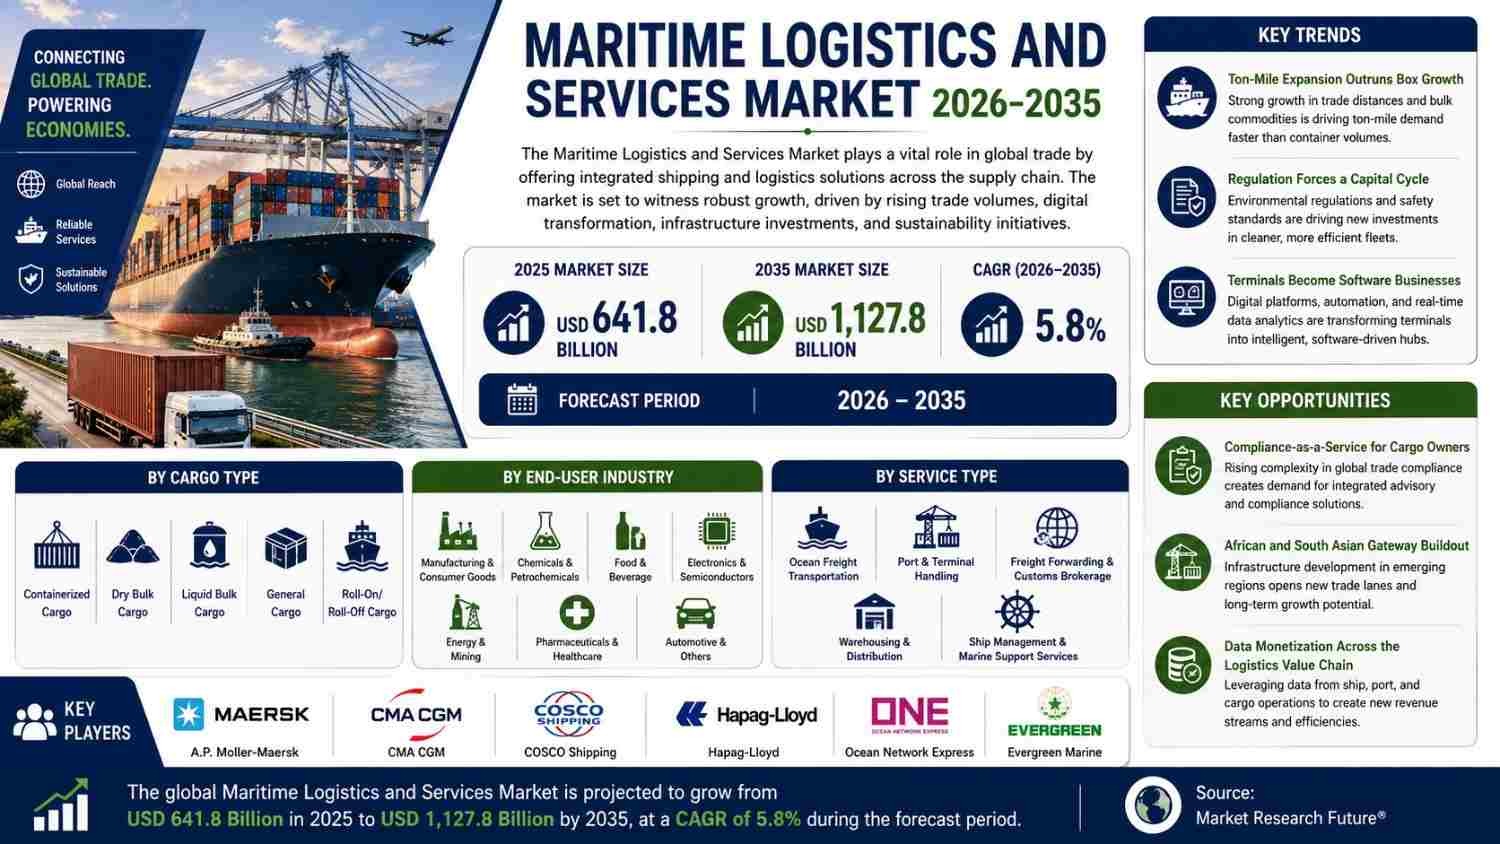
Maritime Logistics Services Market (2026 - 2035)
Asia-Pacific leads the Maritime Logistics and Services Market with a 40.2% revenue share in 2025
OMAN, UNITED ARAB EMIRATES, August 20, 2026 /EINPresswire.com/ -- The global maritime logistics services market stands at an inflection point. Valued at an estimated $641.8 billion in 2025, the market is projected to grow from $679.0 billion in 2026 to approximately $1,127.8 billion by 2035, registering a compound annual growth rate of 5.8%. This trajectory is being driven by a convergence of regulatory mandates that are converting environmental compliance into a commercial product, the permanent lengthening of global shipping routes due to geopolitical chokepoint disruptions, and the digitization of trade documentation that is finally displacing the paper-and-phone spine of ocean freight.The Regulatory and Geopolitical Architecture
Two powerful forces are reshaping the competitive landscape. The International Maritime Organization's Net-Zero Framework, agreed in 2025, sets a binding greenhouse-gas fuel-intensity trajectory that pulls forward roughly $1.5 trillion in fleet renewal and bunkering infrastructure spend through 2050. This is the sector's first worldwide carbon charge, and it is converting environmental policy directly into balance-sheet pressure for carriers and a new revenue line for operators who can sell compliance-managed services.
Simultaneously, rerouting around the Red Sea and drought-constrained Panama Canal transits has permanently lengthened average voyage distances. United Nations Conference on Trade and Development analysis found that while seaborne trade reached approximately 12.6 billion tons in 2024, ton-miles increased nearly twice as quickly. Longer journeys increase income collected per unit shipped, tighten supply-demand balance, and absorb effective capacity. Even once chokepoints reopen, this structural lengthening continues because carriers retain schedule buffers and shippers now factor price resilience into routing decisions.
On the technology front, manual bills of lading, electronic data interchange batch files, and telephone booking desks are giving way to electronic transferable records, API-native booking platforms, and predictive berth scheduling. Digital platforms now intermediate close to 74% of container transactions and have cut average terminal dwell time by 13%. Global port authorities committed over $82 billion in terminal automation and shore-power capital expenditure between 2023 and 2025.
Get Report Sample Copy with TOC: https://www.marketresearchfuture.com/sample_request/8758
Market Size and Forecast Trajectory
Market Research Future's estimates blend vessel-level automatic identification system movement data, port authority throughput disclosures, carrier and forwarder financial filings, and customs trade statistics, triangulated against freight-rate indices and reconciled through primary interviews with shippers, terminal operators, and non-vessel-operating common carriers. The market has grown from $512.4 billion in 2021 and is expected to reach $760.1 billion by 2028 before climbing steadily toward the $1,127.8 billion endpoint in 2035.
Segment Analysis by Cargo Type
Containerized cargo holds the largest share of the maritime logistics services market, capturing approximately 34.8% of revenue in 2025. This dominance reflects the segment's role as the commercial engine of ocean trade, carrying the highest revenue per ton and supporting the richest service layer including customs brokerage, cargo insurance, visibility subscriptions, and inland drayage. Consumer-goods restocking cycles and e-commerce flows sustain baseline demand.
Dry bulk cargo accounted for approximately $197.0 billion in 2025, tracking iron ore, coal, grain, and bauxite flows. While lower margin than containerized trade, dry bulk provides portfolio ballast because it is far less exposed to the rate-collapse risk that overcapacity poses to liner trades. Liquid bulk cargo is growing at a 4.3% CAGR, serving crude oil, refined products, and chemical parcel movements.
Roll-on/roll-off cargo is the fastest-growing cargo type, projected to expand at a 6.9% CAGR through 2035. Chinese vehicle exports have pushed car-carrier utilization to near-historic highs and triggered the largest pure car and truck carrier newbuild wave in two decades. General cargo captured roughly 9.1% of the market, serving project cargo, steel, and forest products.
Segment Analysis by End-User Industry
Manufacturing and consumer goods represent the largest end-user industry, commanding approximately 29.5% of demand in 2025. These shippers sign annual contracts, tolerate standardized service, and fill the base load that makes weekly liner strings viable. Chemicals and petrochemicals contributed approximately $118.1 billion, tracking Gulf and Asian petrochemical capacity additions.
Food and beverage captured roughly 16.2% of the market, driven by reefer produce, protein, and beverage exports. Energy and mining contributed approximately $82.8 billion, serving coal, liquefied natural gas feeder, and critical minerals flows. Electronics and semiconductors are growing at a 5.6% CAGR, reflecting fab buildout and component distribution networks.
Pharmaceuticals and healthcare is the fastest-growing end-user segment, expanding at a 5.9% CAGR. As controlled-atmosphere reefer containers attain verified stability characteristics, air-to-ocean conversion for temperature-controlled pharmaceuticals is quickening. For pharmaceutical companies under scrutiny for logistics emissions, the sustainability reporting benefit is significant, and the cost difference versus air freight is roughly an order of magnitude. These shippers demand continuous temperature telemetry, chain-of-custody documentation, and contingency routing that most ocean carriers historically did not offer. Automotive and other end users captured roughly 3.0% of the market.
Buy Now: https://www.marketresearchfuture.com/checkout?currency=one_user-USD&report_id=8758
Segment Analysis by Service Type
Ocean freight transportation dominates by service type, accounting for approximately 46.3% of market revenue in 2025. However, this segment delivers the thinnest and most cyclical margins because it is the most exposed to vessel overcapacity and spot-rate volatility.
Port and terminal handling generated approximately $138.0 billion in 2025. This segment behaves like infrastructure, with concession-protected, capital-intensive revenue streams that are remarkably stable. Financial sponsors have bid terminal assets to premium multiples precisely because of this stability. Freight forwarding and customs brokerage captured roughly 16.8% of the market, serving trade-compliance complexity and multimodal orchestration needs.
Warehousing and distribution is the fastest-growing service type, expanding at a 6.7% CAGR. Port-centric fulfillment is emerging as a strategic imperative, with inventory positioned inside free zones adjacent to gateways cutting inland drayage, deferring duty, and enabling faster regional replenishment than centralized inland distribution centers. Ship management and marine support services are growing at a 6.2% CAGR, serving technical management, crewing, and bunkering demand.
Regional Landscape: Asia-Pacific Dominates, All Regions Expand
Asia-Pacific commands the largest share of the maritime logistics services market at approximately 40.2% of revenue in 2025, and it is also the fastest-growing region with a projected 6.3% CAGR through 2035. This dominance reflects the region's role as the anchor of intra-Asian trade, which now exceeds transpacific volume. China alone captures roughly 41.8% of the regional share through its container manufacturing base and mega-port throughput. India is expanding at a 7.4% CAGR, supported by the Sagarmala program and the commissioning of Vizhinjam International Seaport, which gives the subcontinent its first natural deep-draft transshipment terminal capable of retaining cargo previously routed through Colombo and Singapore. Japan contributed approximately $27.4 billion, focused on automotive roll-on/roll-off and ammonia bunkering trials. South Korea holds roughly 9.7% of the regional share through shipbuilding leadership and Busan transshipment capacity. The ASEAN bloc contributed approximately $44.9 billion, with Singapore's Tuas mega-port continuing phased delivery toward a 65 million twenty-foot equivalent unit design capacity. The rest of Asia-Pacific is expanding at a 6.0% CAGR through Australian bulk exports and Pacific feeder consolidation.
Europe holds the second-largest global share at approximately 24.6%, generating roughly $157.9 billion in 2025. The region carries the heaviest regulatory load and the deepest compliance expertise. FuelEU Maritime obligations began biting in 2025, and the extension of the EU Emissions Trading System coverage to a full 100% of intra-European Union emissions removes the phase-in cushion. Germany anchors the region with approximately 18.9% of European share through Hamburg-Bremerhaven hinterland rail density. The United Kingdom contributed approximately $21.3 billion, repositioning through freeport policy and transshipment restructuring. France captures roughly 11.4% of the regional share through the Le Havre corridor and inland waterway shift. Italy is growing at a 5.4% CAGR through Mediterranean transshipment and Africa feeder links. Spain contributed approximately $14.2 billion through Algeciras and Valencia hub throughput. The Nordic countries are expanding at a 5.9% CAGR, driven by shore power mandates and short-sea electrification. Russia captured roughly 4.1% of regional share through redirected Arctic and Pacific-facing flows. The rest of Europe contributed approximately $24.9 billion through Black Sea and Adriatic gateway diversification. Rotterdam and Antwerp-Bruges together committed over EUR 1.5 billion to quay-side power and hydrogen import readiness.
North America generated approximately $127.1 billion in 2025, representing roughly 19.8% of global revenue. The United States dominates with approximately 74.6% of the regional share, with Gulf and East Coast gateway expansion absorbing nearshoring-driven volume. The Port Infrastructure Development Program has awarded well over $3 billion since 2022 toward berth rehabilitation, rail interchange, and zero-emission cargo handling equipment, while the Environmental Protection Agency's Clean Ports Program directed roughly $3 billion more into electrification and hydrogen pilots. Canada contributed approximately $21.6 billion through Prince Rupert and Montreal corridor capacity. Mexico is the fastest-growing North American market, expanding at a 6.4% CAGR as Pacific and Gulf ports absorb the nearshoring dividend, though rail congestion at inland crossings remains the binding constraint.
South America was valued at approximately $41.2 billion in 2025. Brazil dominates with roughly 52.3% of the regional share through grain, iron ore, and Santos terminal expansion. Argentina contributed approximately $6.9 billion through Paraná waterway agri-export flows. The rest of South America is growing at a 7.1% CAGR, with the Chancay multipurpose terminal in Peru launching direct Asia-South America sailings that cut Pacific transit by roughly ten days versus routings through Mexican and Panamanian hubs.
Report Summary: https://www.marketresearchfuture.com/reports/maritime-logistics-services-market-8758
The Middle East and Africa region is expanding at a 6.1% CAGR, the second-fastest regional growth rate globally. Saudi Arabia leads with approximately 24.6% of regional share, with Vision 2030 targeting a top-ten global logistics ranking by 2030 backed by more than $130 billion of programmed transport investment across ports, rail, and industrial zones. The United Arab Emirates contributed approximately $16.4 billion through Jebel Ali free-zone integration and terminal operations. South Africa is growing at a 5.8% CAGR through Durban and Ngqura efficiency recovery programs. Egypt captures roughly 14.1% of the regional share through Suez Canal Economic Zone industrial clustering. The rest of the region contributed approximately $12.7 billion through West African concessions and Indian Ocean feeder networks.
Competitive Landscape
The maritime logistics services market exhibits medium concentration, with an estimated Herfindahl-Hirschman Index near 780 and the top five operators collectively holding approximately 44% of global revenue. Liner shipping is the concentrated core, while forwarding, terminal operation, and marine services remain fragmented, populated by thousands of regional specialists. Alliance restructuring, most visibly the Gemini Cooperation, has shifted competition from raw capacity toward schedule reliability, with hub-and-spoke network operators publicly targeting roughly 84% on-time performance.
Mediterranean Shipping Company leads with an estimated 11 to 14% revenue share as the world's largest container carrier by fleet capacity, operating a global liner network, terminals, and inland logistics through organic and acquisitive scale. A.P. Moller-Maersk captures roughly 9 to 12% as an end-to-end integrator spanning ocean, air, contract logistics, and terminals, and as a methanol fleet leader with the most advanced dual-fuel newbuild program among Western carriers.
CMA CGM holds approximately 8 to 10% through diversified liner services, CEVA Logistics, terminal concessions, and expansion into media and air freight. COSCO Shipping captures roughly 7 to 9% as a state-backed operator with Belt and Road corridor alignment and integrated container and bulk shipping with port operations. Hapag-Lloyd accounts for approximately 5 to 7% as a Gemini Cooperation partner pursuing reliability-led differentiation through terminal investments.
Ocean Network Express holds roughly 4 to 6% as the consolidated Japanese carrier with a lean cost base. Evergreen Marine captures approximately 3 to 5% through Asia-centric density and disciplined capital expenditure. DP World holds roughly 2 to 4% through gateway infrastructure, terminal operations, free zones, and feeder logistics. HMM accounts for approximately 2 to 3% as the Korean flag carrier with premium tonnage renewal. Kuehne+Nagel captures roughly 2 to 3% as an asset-light forwarding and digital control tower specialist. DSV holds approximately 1 to 2% through acquisition-driven scale in sea freight forwarding and contract logistics.
Similar Report
maritime market https://www.marketresearchfuture.com/reports/maritime-market-41641
Maritime Freight Transport Market https://www.marketresearchfuture.com/reports/maritime-freight-transport-market-11581
US Maritime Logistics Services market https://www.marketresearchfuture.com/reports/us-maritime-logistics-services-market-18915
japan maritime freight transport market https://www.marketresearchfuture.com/reports/japan-maritime-freight-transport-market-57063
germany maritime freight transport market https://www.marketresearchfuture.com/reports/germany-maritime-freight-transport-market-57062
germany maritime logistics services market https://www.marketresearchfuture.com/reports/germany-maritime-logistics-services-market-57215
mexico maritime freight transport market https://www.marketresearchfuture.com/reports/mexico-maritime-freight-transport-market-57067
Market Research Future
Market Research Future
+1 855-661-4441
email us here
Legal Disclaimer:
EIN Presswire provides this news content "as is" without warranty of any kind. We do not accept any responsibility or liability for the accuracy, content, images, videos, licenses, completeness, legality, or reliability of the information contained in this article. If you have any complaints or copyright issues related to this article, kindly contact the author above.
